Data Science in the Financial Sector
Impact, Use Cases, and How to Share your Work
How I got here
It was 2015, and I was pursuing a Master’s degree in Economics.
At the time, my plan was to build an academic career.

- I think I still want that… maybe someday 😅️
How I got here
- But during the program, something big happened.

Teachers went on strike!
My first thought: spend all day at the beach.
As tempting as it was, I needed to be responsible.
How I got here
- That’s when I decided to learn R.
- But it turned out to be quite challenging, since there weren’t many resources available.

Back then, programming was mostly something for CS people.
Free content was scarce, and worst of all — no ChatGPT! Luckily, Stack Overflow had my back.
How I got here
- What started as a way to pass the time turned into a real skill.

- And that opened the door to several great opportunities.
Professional career
- I started out as an applied economist, but I eventually moved into Data Science (or somewhere between the two).
I’m currently leading the Data Science team within the Economic Research department at Kapitalo.
My background involves the use of quantitative methods and data science in the context of macroeconomic research.
Professional career
- I’m also the author of R for Economic Research.
- Available online and free at http://book.rleripio.com
1. New Sources of Information
Unstructured data gained prominence during the COVID-19 pandemic and has become an important part of the analytical process.
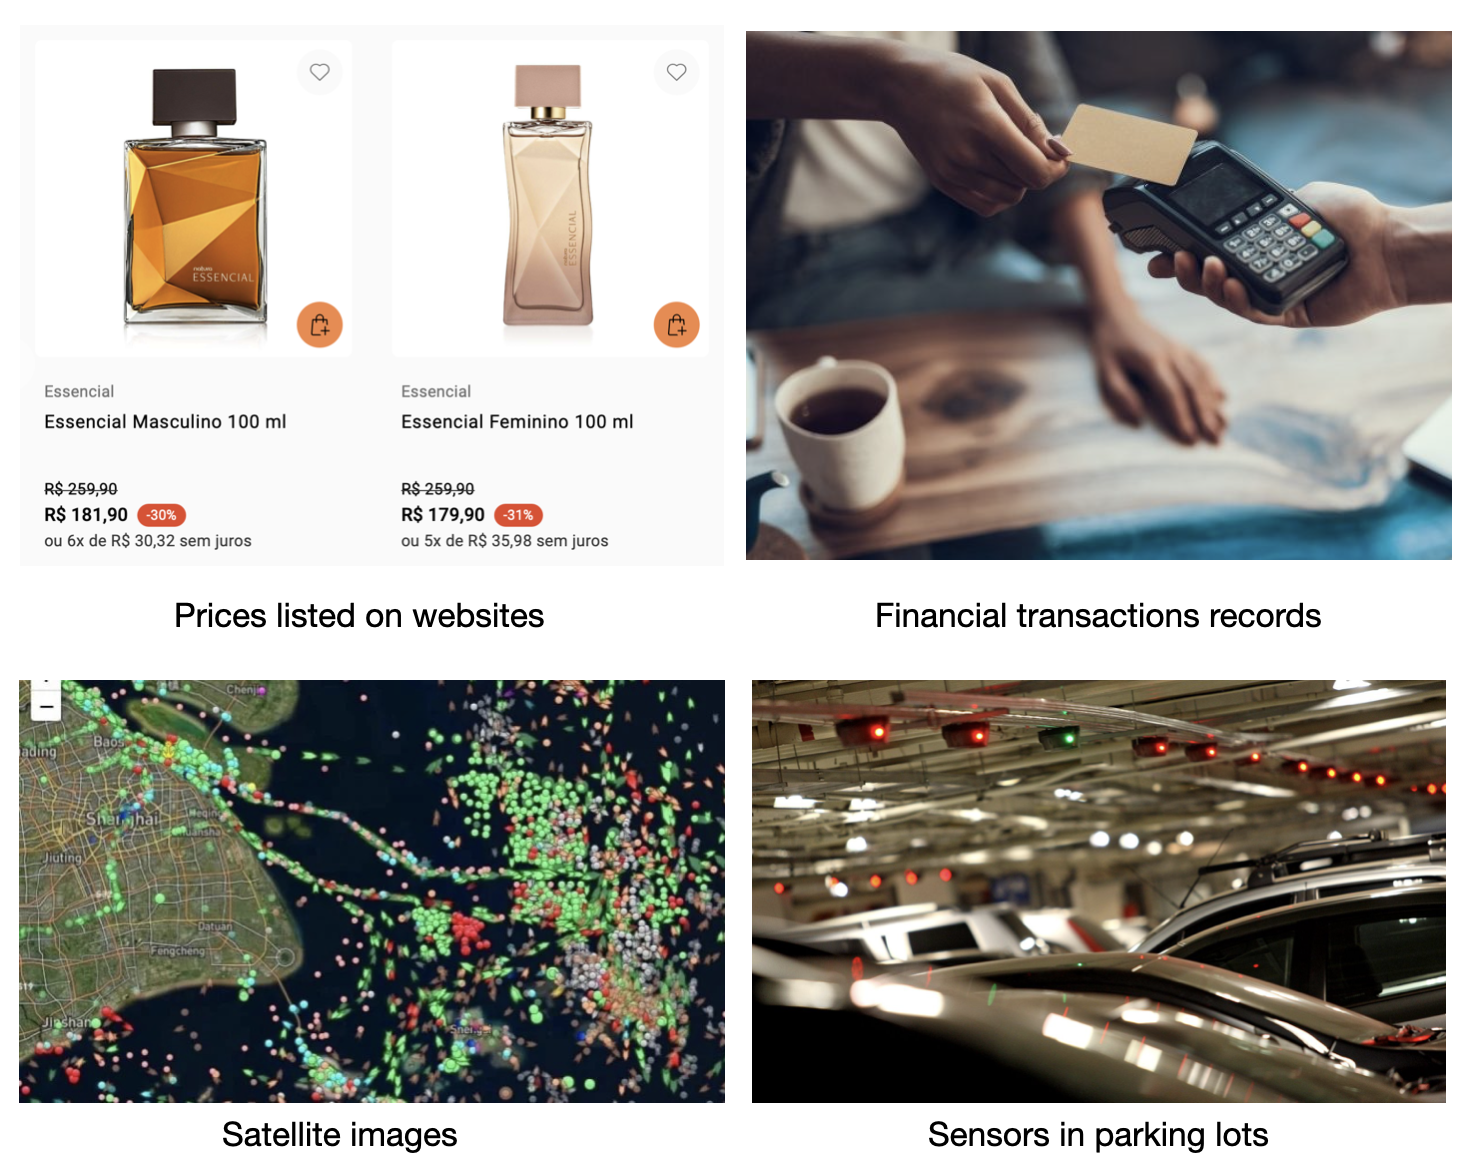
1. New Sources of Information
Numerous studies have highlighted the value of this type of data.
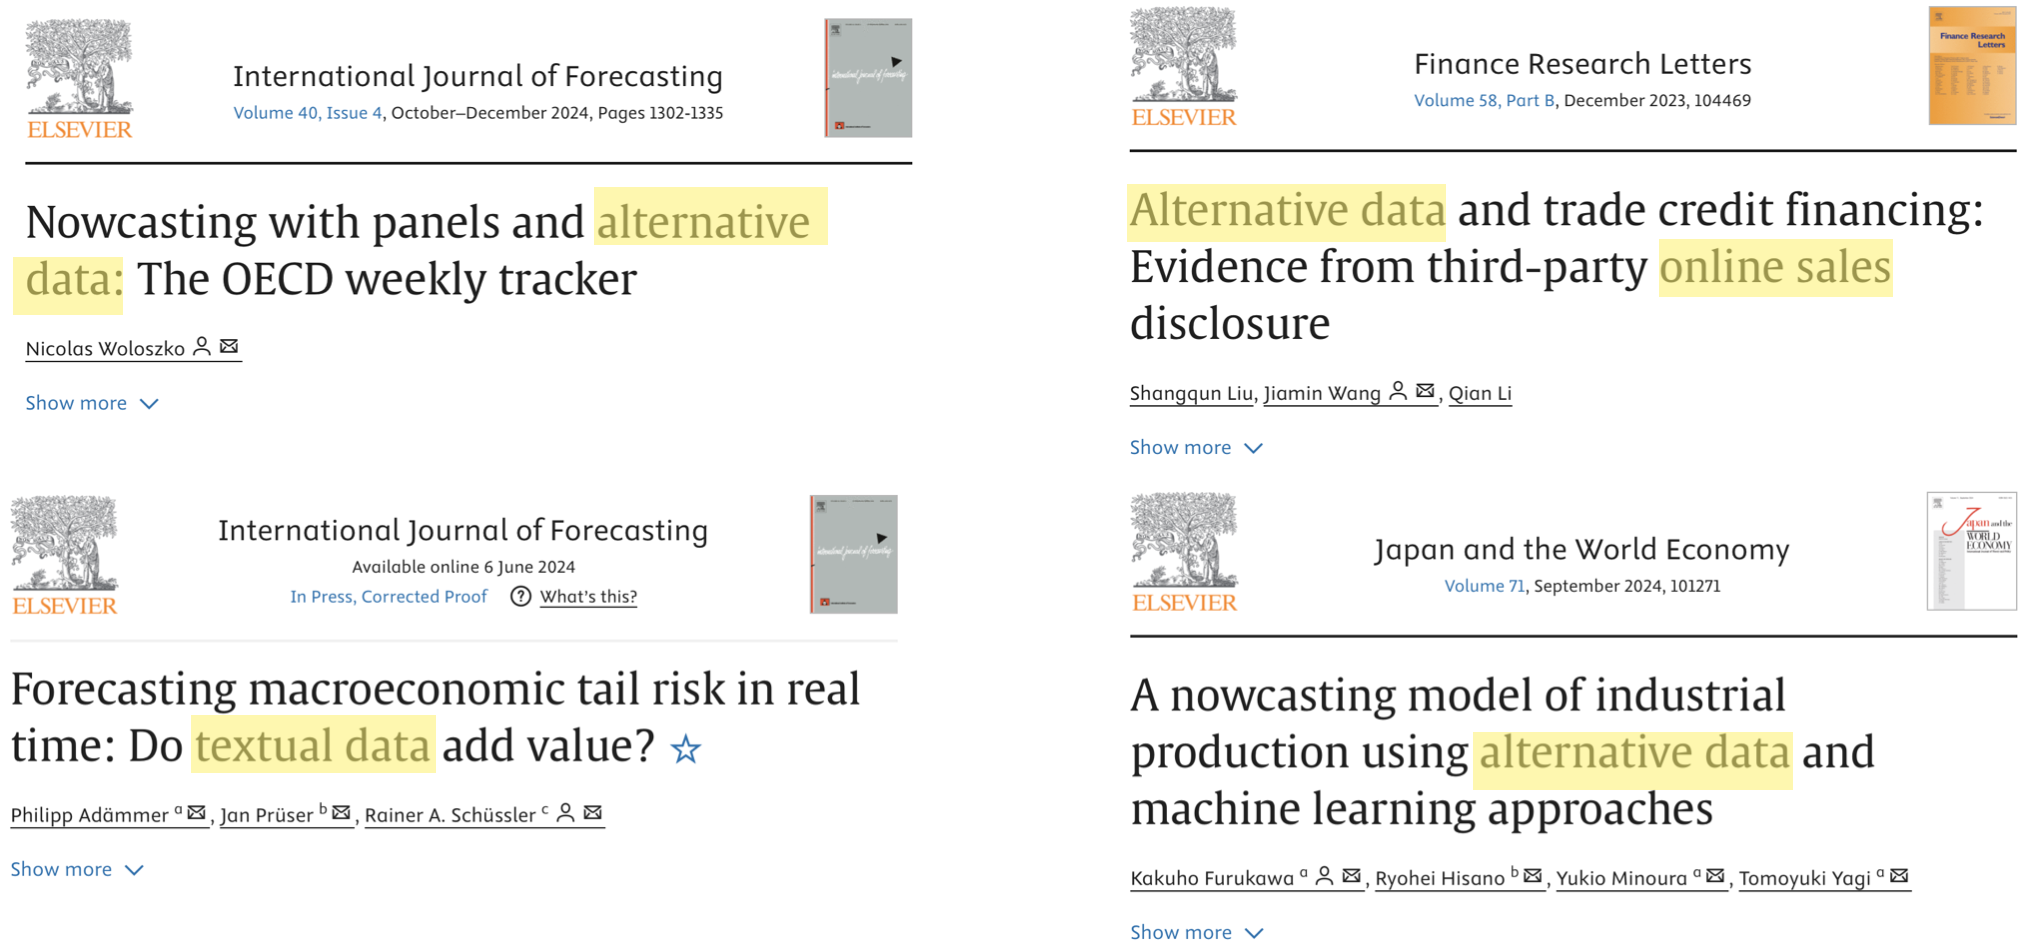
2. New Methods
Sample of over 5,000 papers in the economics and finance literature between 1990 and 2021 containing selected keywords.

2. New Methods
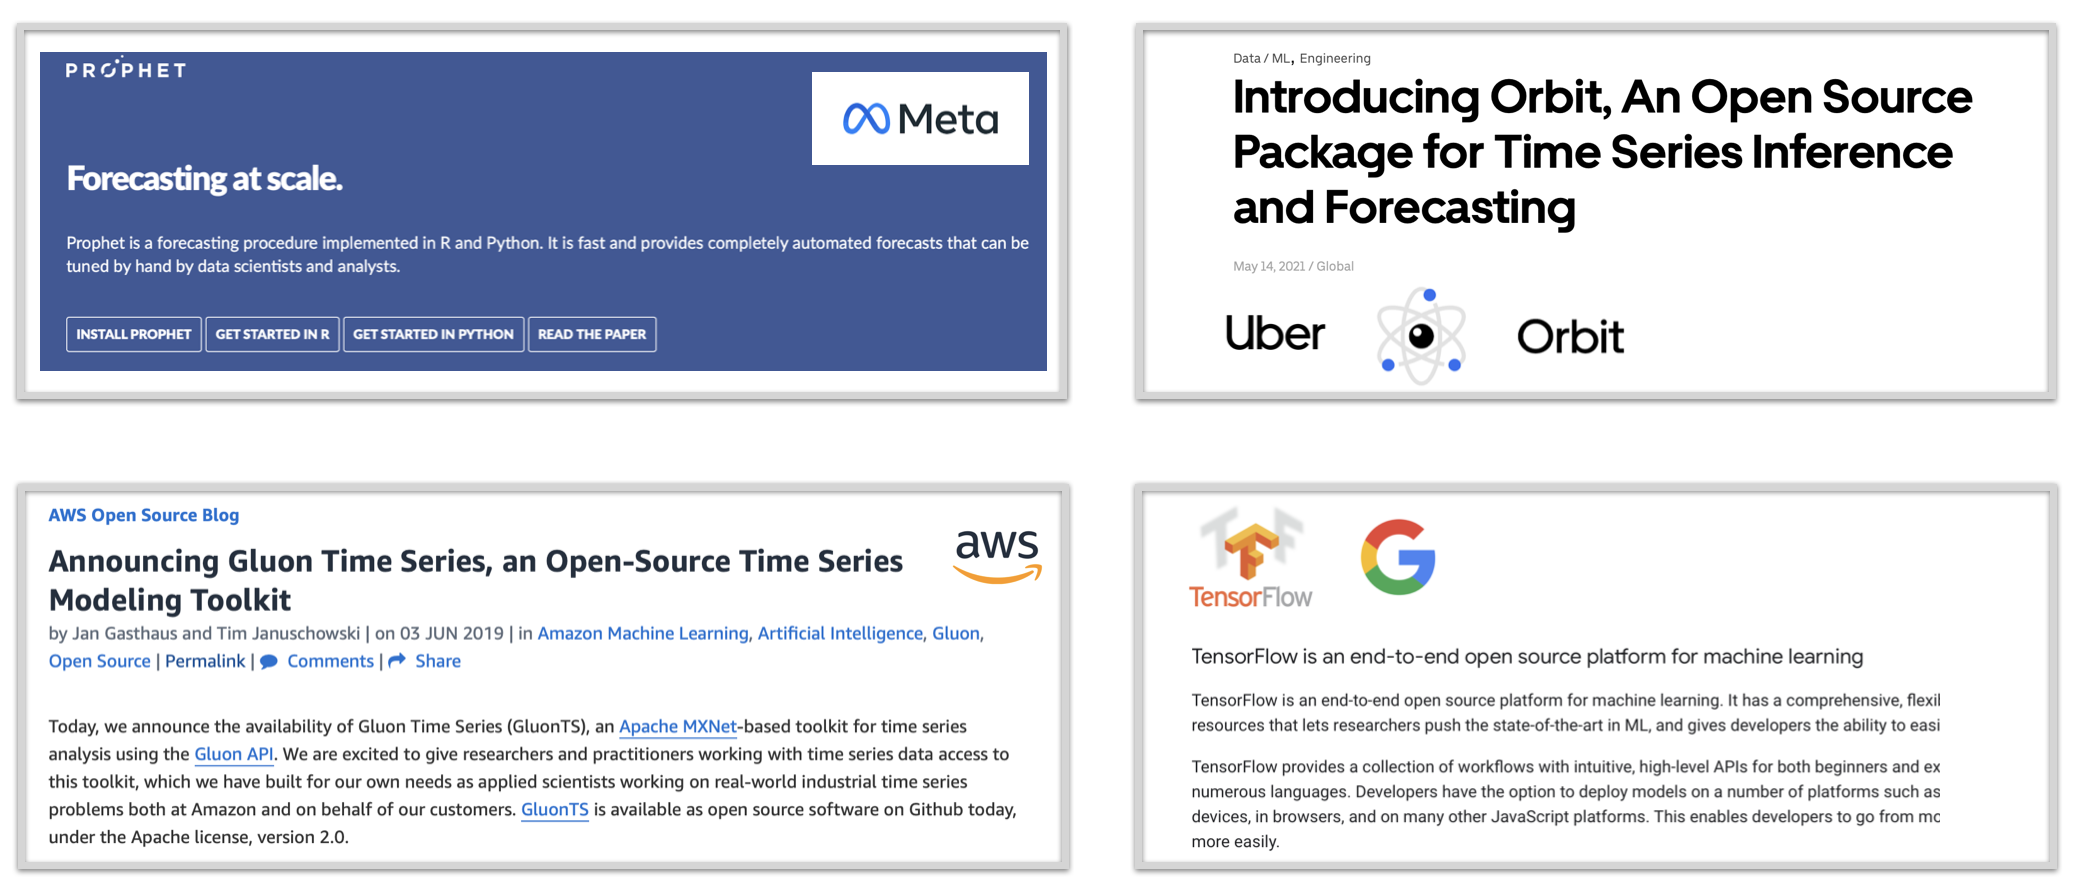
Open-source tools have been a gateway to new technologies..
3. Automation and Scale
Typical Stages of a Data Analysis Workflow Using Closed-Source Softwares
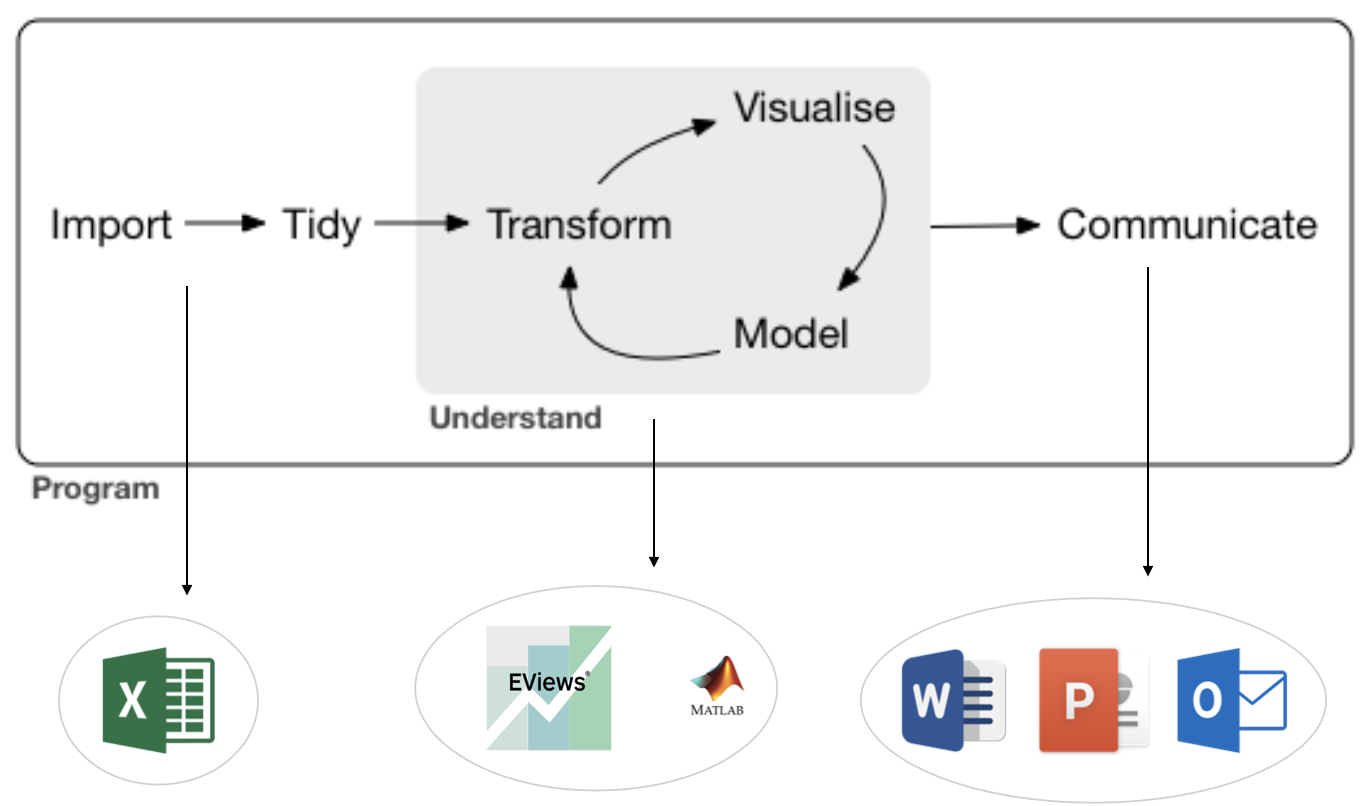
A series of copy-and-paste steps.
Limited ability to scale.
Reproducibility issues are common.
3. Automation and Scale
The Advantages of Open-source Workflows
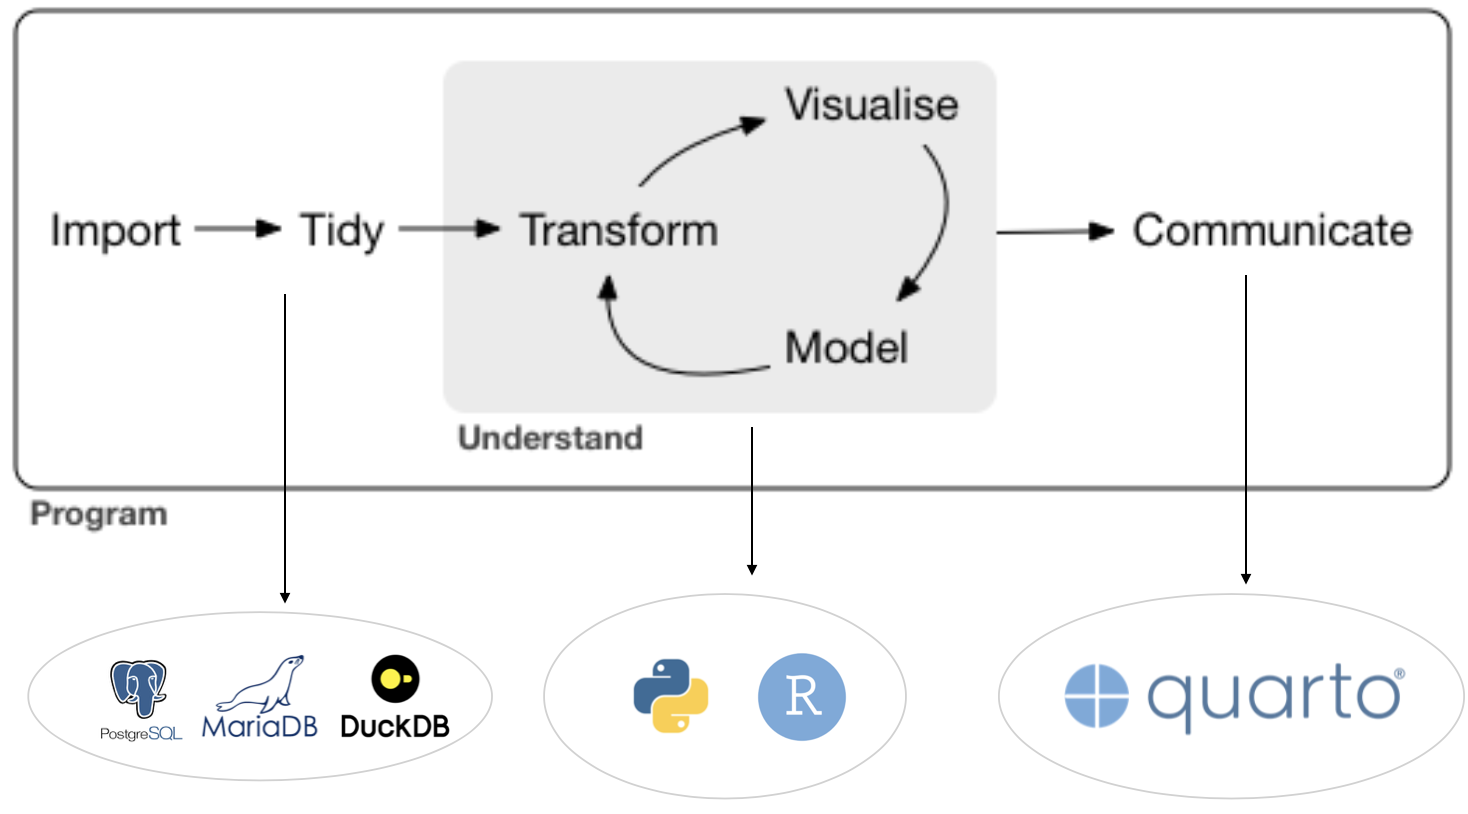
Integrated environments create direct and efficient communication between tasks.
Continuous updates and packages releases bring new features and improvements.
Better error handling and debugging.
Open-source software usually runs smoothly on any OS.
Implications for day-to-day work
Every company uses these tools to some extent.
Better forecasting methods and the ability to handle more data sources \(\rightarrow\) improved accuracy.
Automation: models, reports, and scenario revisions.
Scale: analyses can be easily expanded to cover more countries/industries.
But, creating an automation is one thing — making sure everything runs smoothly every day is another.

You Are Now in Production
Whether You Know It or Not.
Production is often seen as a distant ideal — built for big infrastructure, not simple scripts.
But as Alex K. Gold brilliantly puts it: “If you’re a data scientist putting your work in front of someone else’s eyes, you’re in production.”
- Now all you need to do is make your work reliable – or, in other words,reproducible. How?
The basic reproducibility layers
Ensuring reproducibility gets harder as we move down the stack
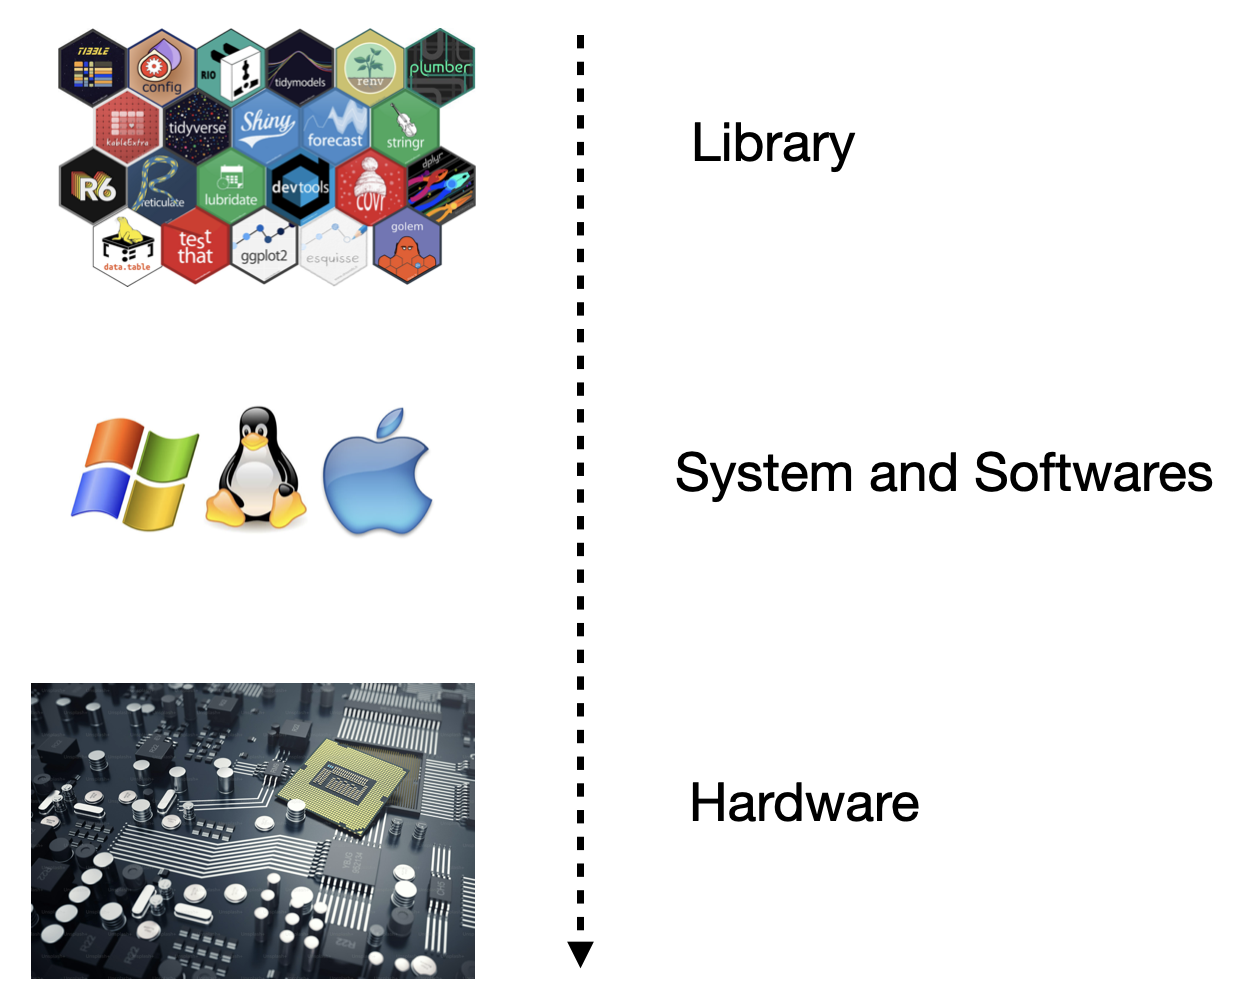
- While full reproducibility is nearly impossible, maintaining a minimum standard is essential.
The Library Layer
It’s the most essential layer to pay attention to.
Packages are updated frequently.
Sometimes, functions from a previous version behave differently or are no longer available.
We need to make sure that the user (or our future self) can use the same library we used when writing the code.
The
renvpackage was built exactly for this purpose.

- It creates a project-level library and records metadata for all the packages used, making the project portable across machines.
The System and Software Layer
Sometimes, ensuring we are using the right library is not enough
When scraping data from websites, for example, we often need to interact with a web browser and its extensions. If something changes, the workflow may fail.
In such cases,
Dockeris the go-to tool. It lets us build a self-contained environment — called an image — with the desired OS and all necessary software.This is also useful for hosting applications like Shiny apps and Plumber APIs.
An additional benefit is that most cloud providers support deploying applications directly from Docker images.
Financial Transactions Data
Offered key insights into the magnitude of the downturn and the trajectory of the recovery during the COVID crisis.
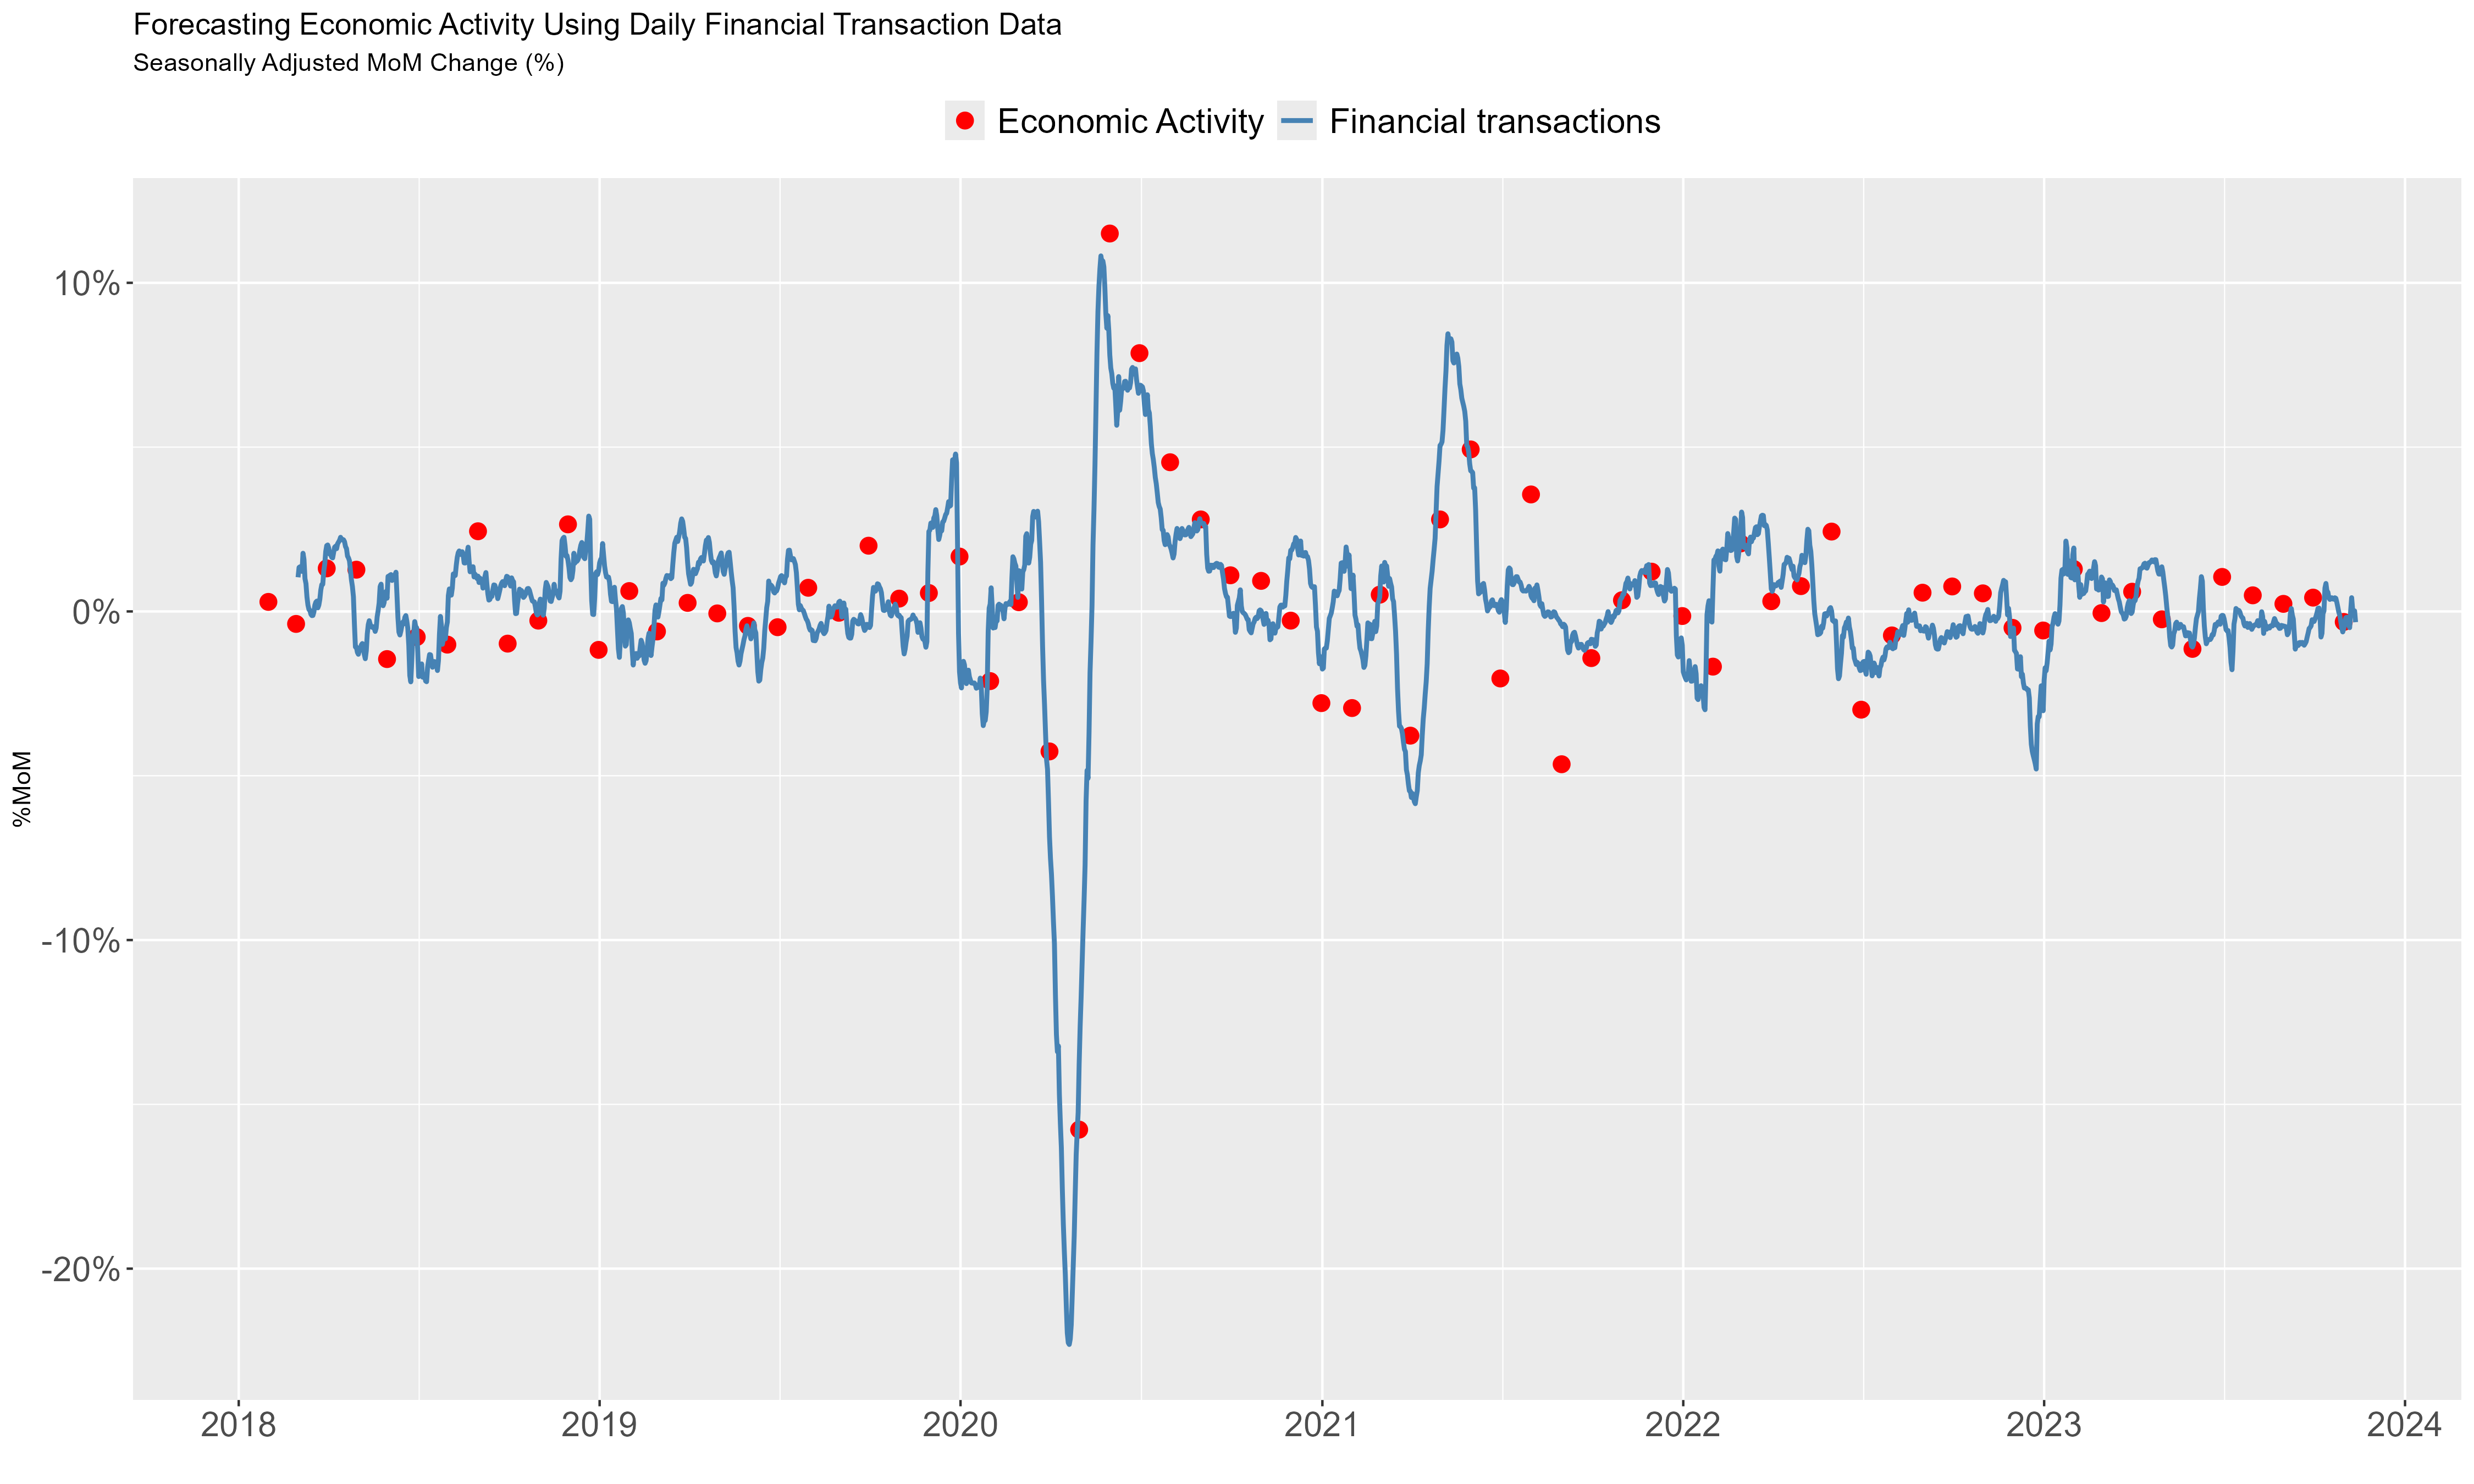
- But also proved informative in other key moments.
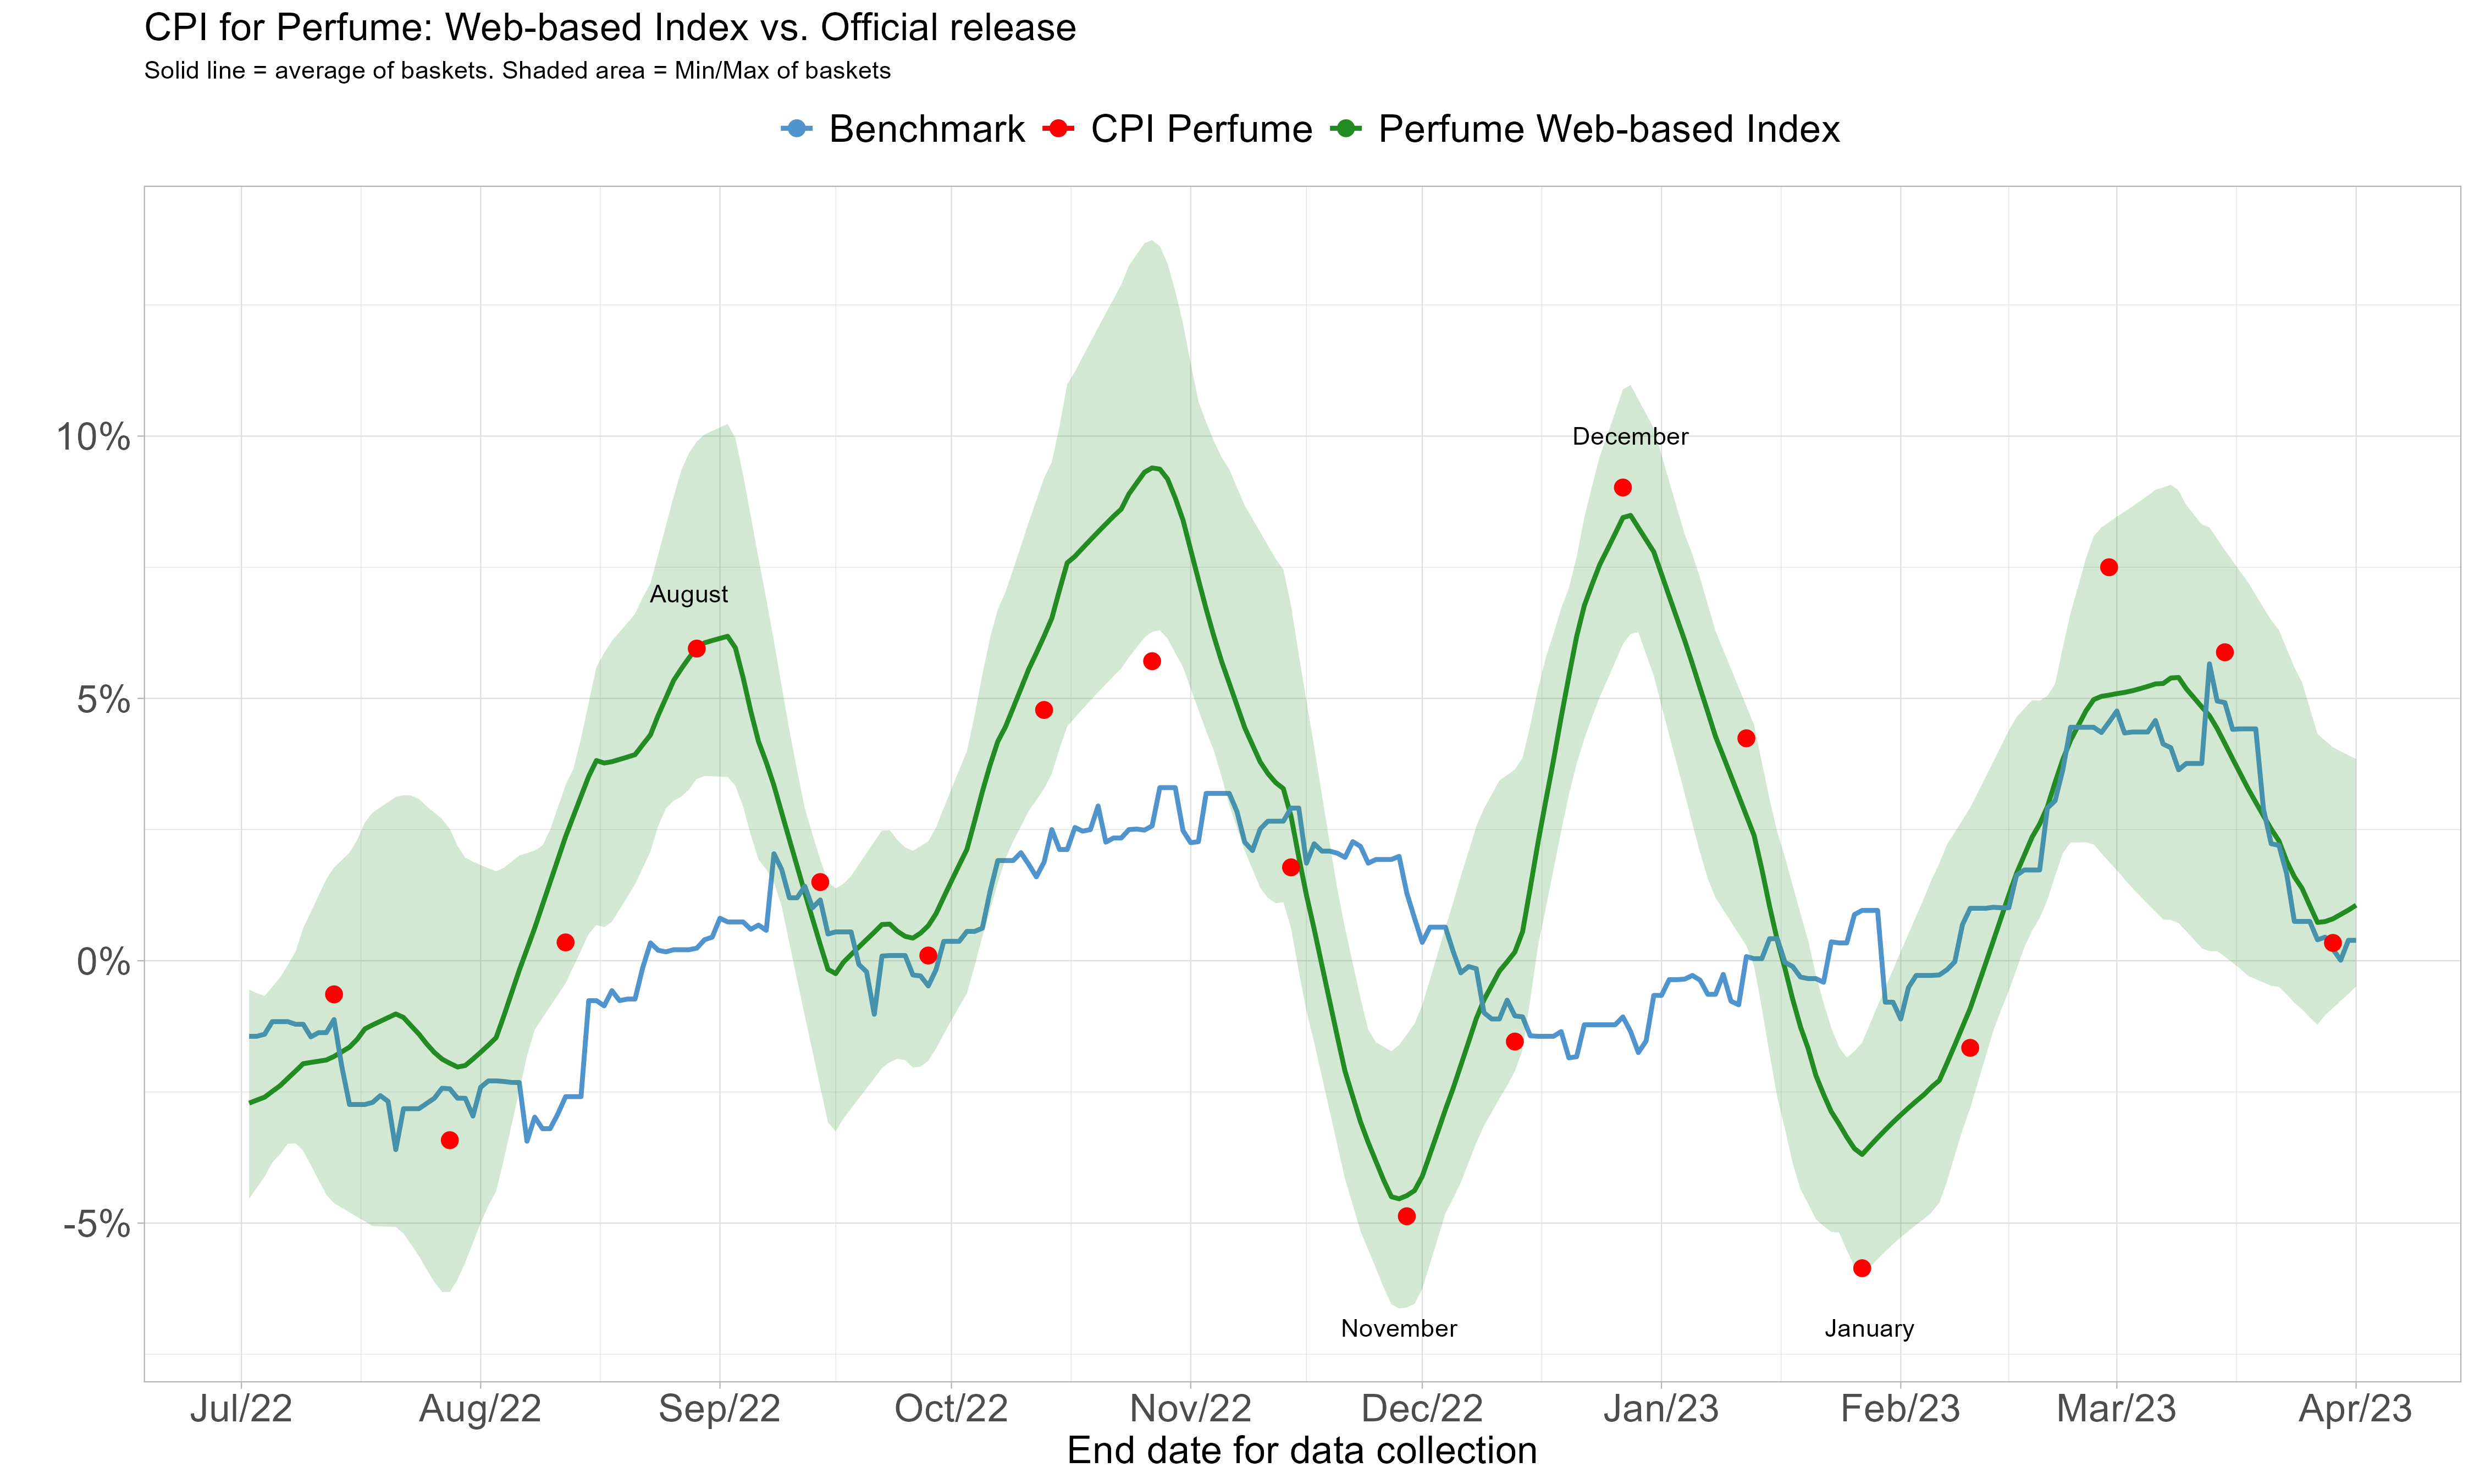
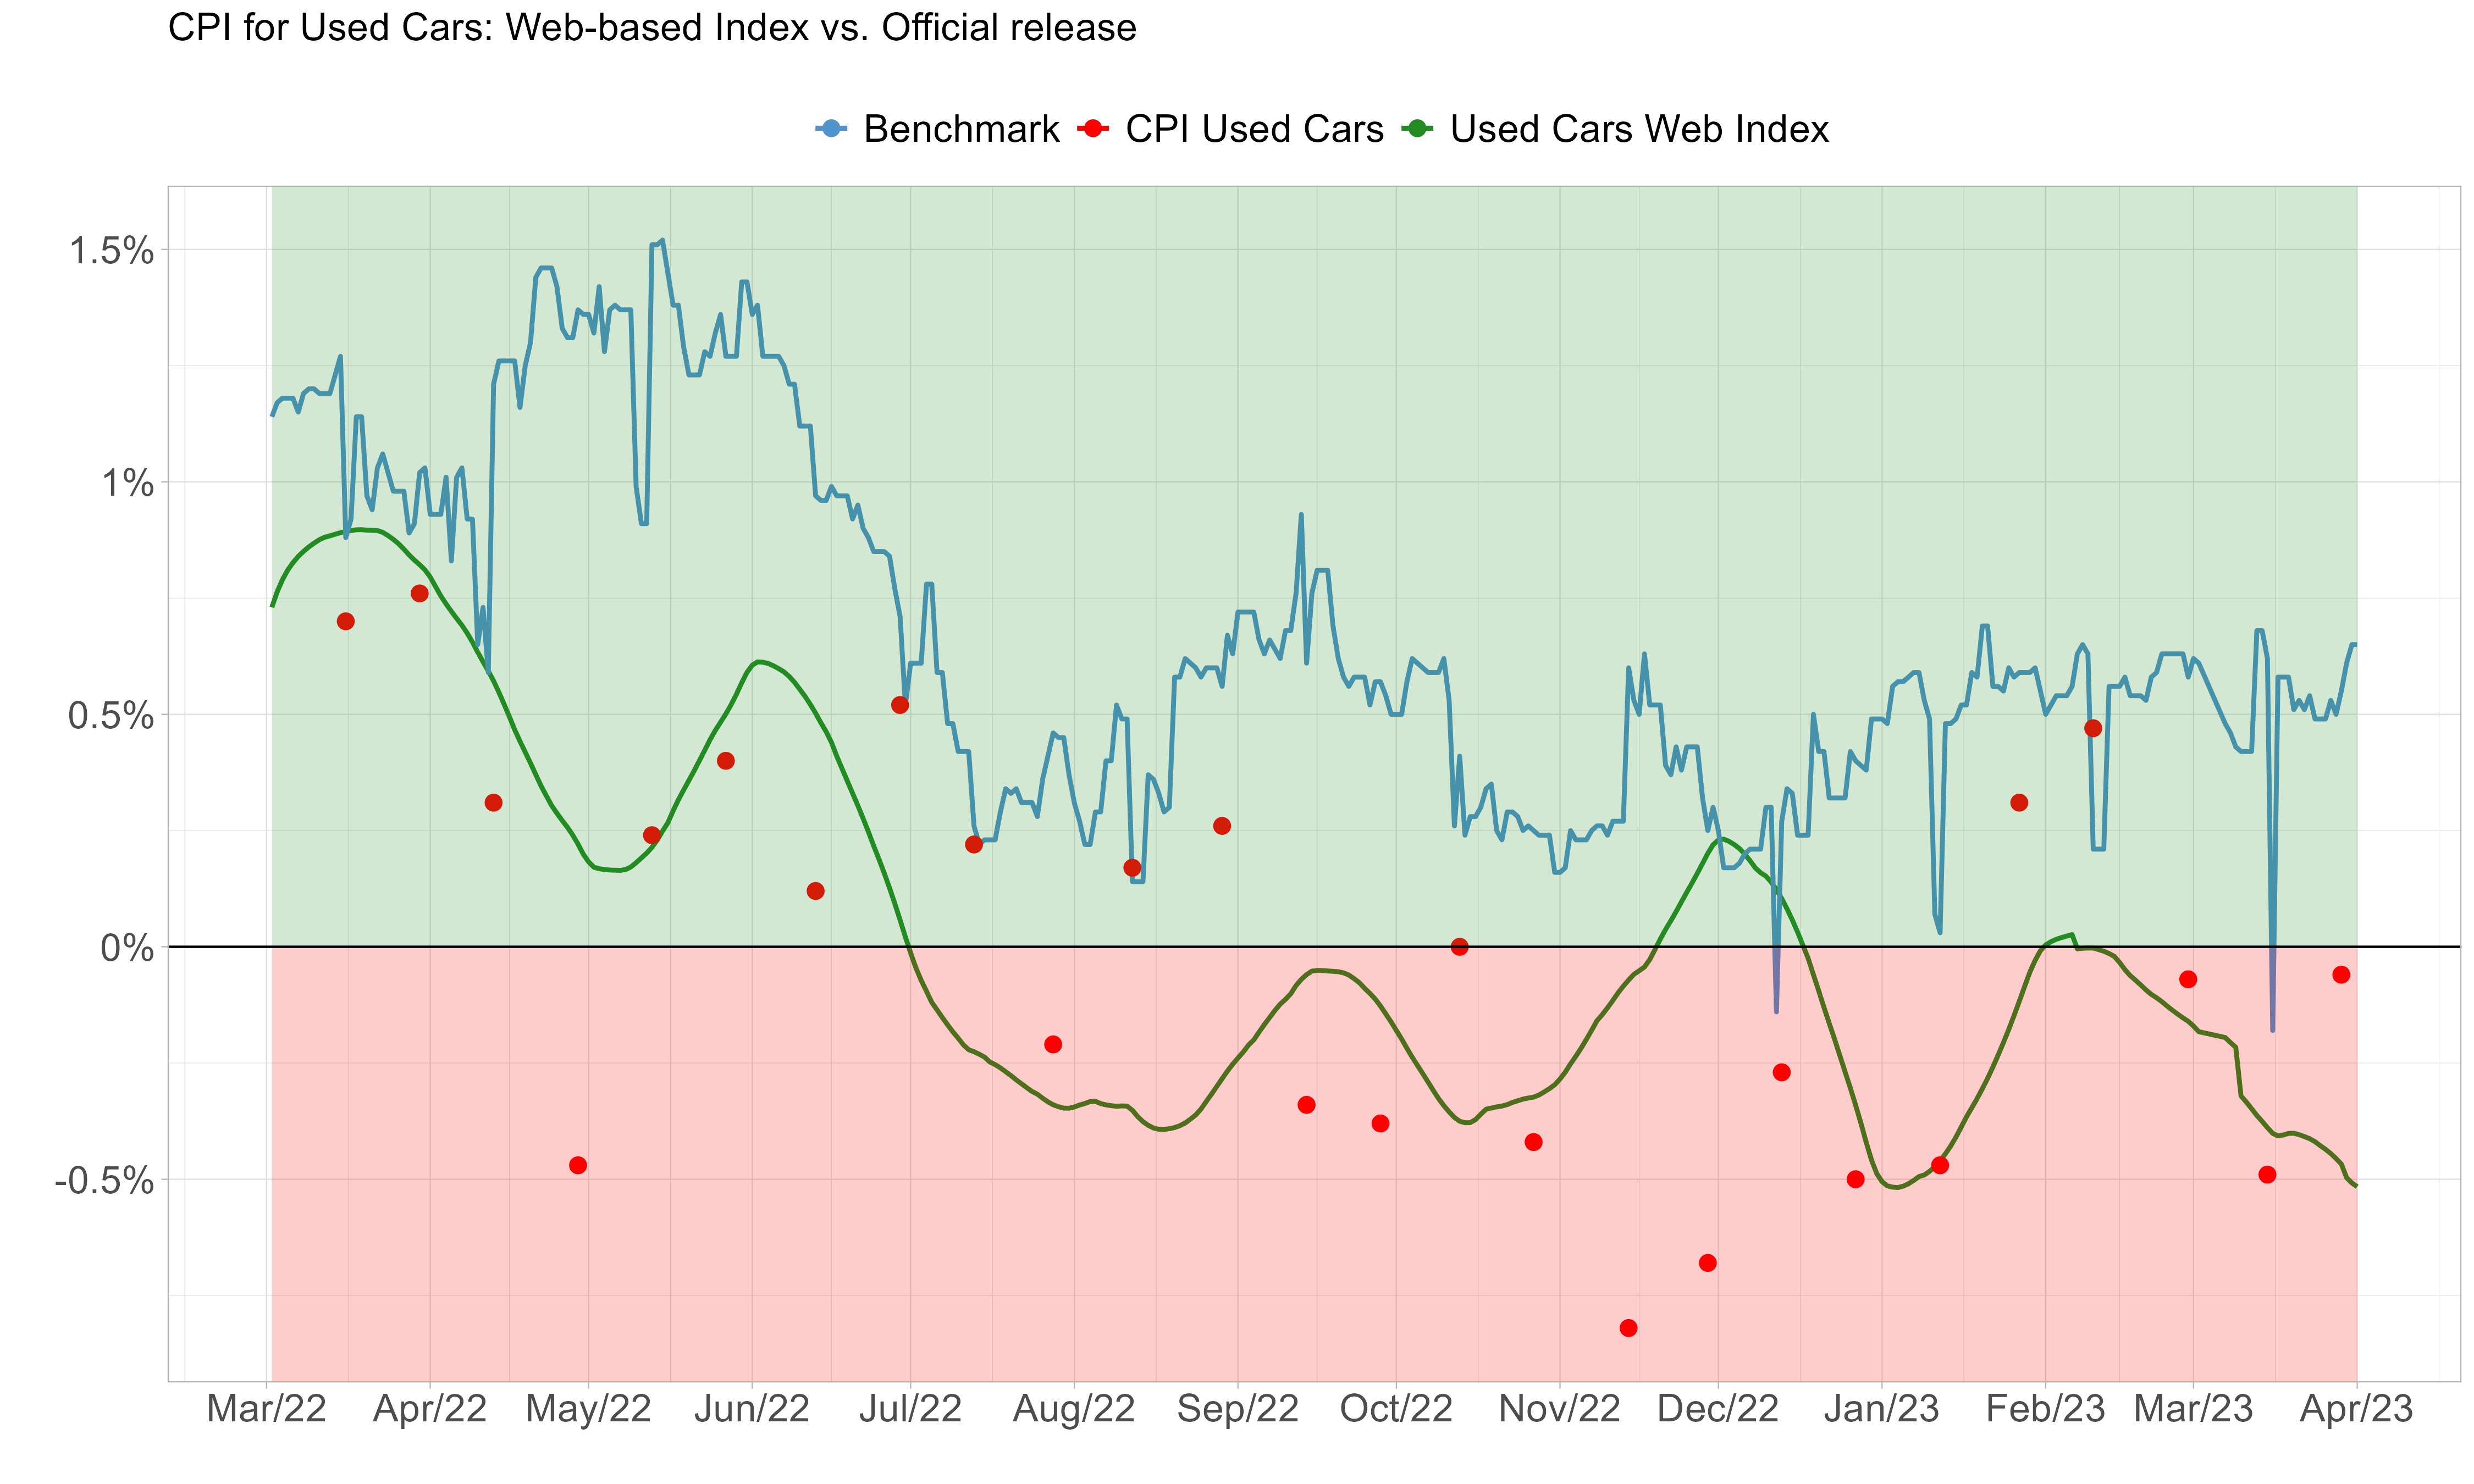
Prices collected from websites
The CPI component for perfumes poses a persistent challenge for inflation analysis.
Prices collected from websites
The steady drop in used car prices from 2022 to 2023 caught the market off guard.
GDP Nowcasting
Real-time assessment of GDP
![]()
- Timely model updates require managing a complex pipeline
The full pipeline
Changes in the database trigger all downstream processes
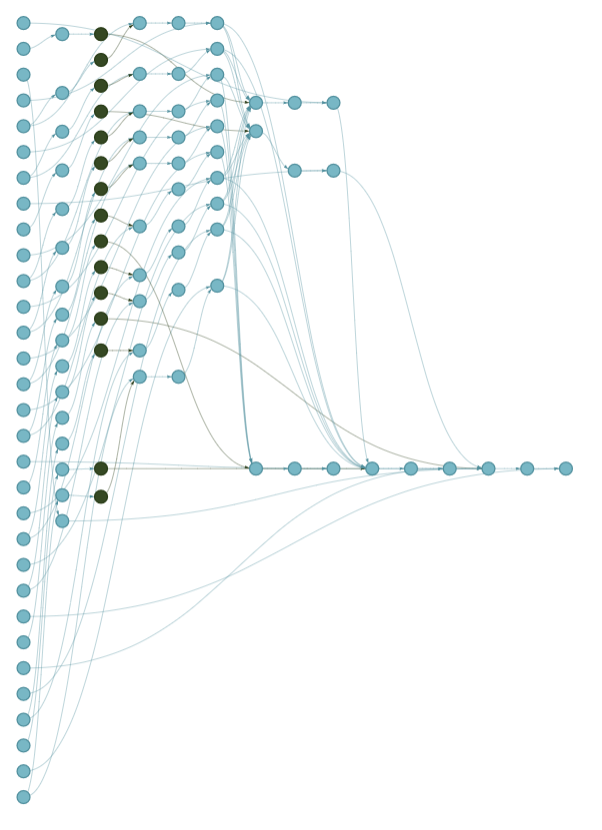
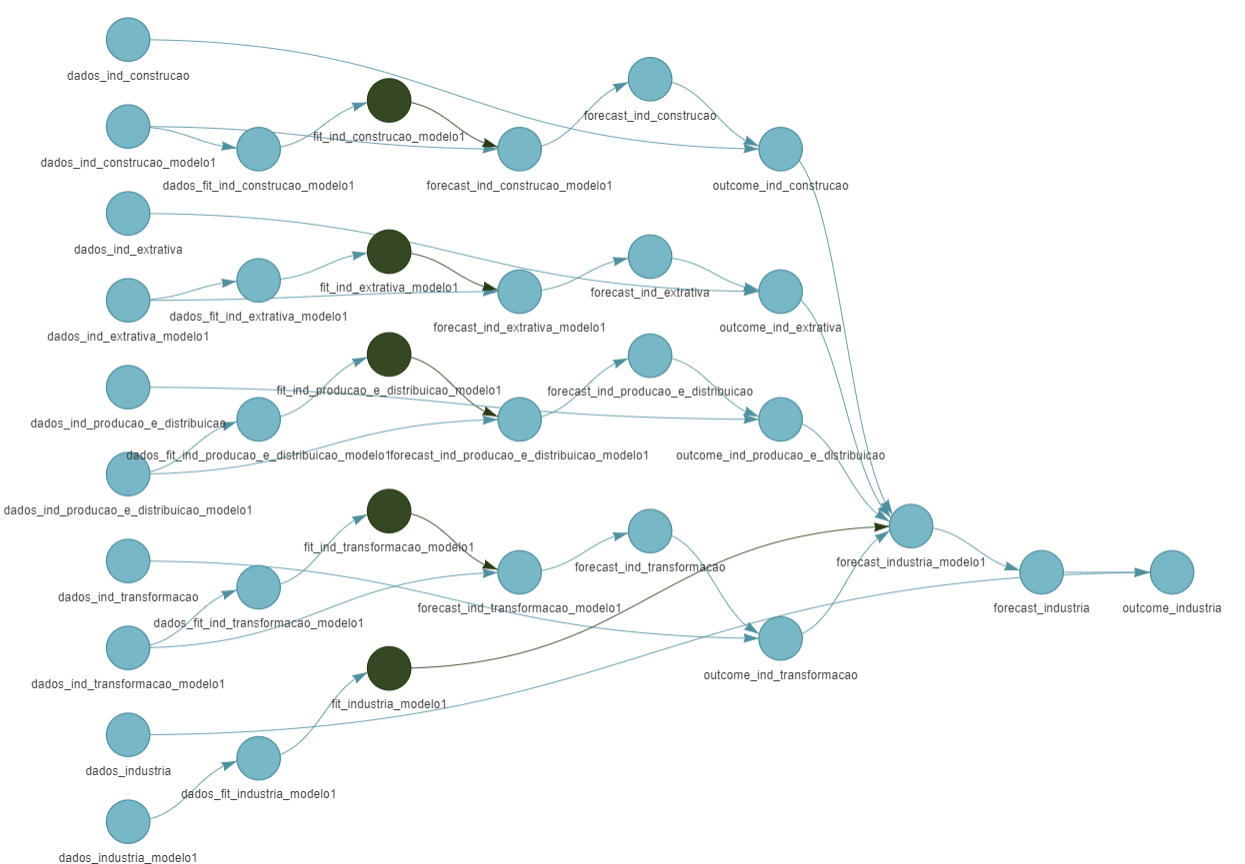
Processes that are not related to the upcoming data are left unchanged. This is critical for ensuring efficiency.
Numbers: > 60 variables; 18 equations; > 100 targets. Handling this manually is inefficient, error-prone, and doesn’t scale well.
Pipelines in R
R offers powerful tools to design and manage complex pipelines


- Packages come and go. You might use R, Python, or something else. But what truly matters is understanding the coreprinciples.
Further reading on the topics covered today
Available online and free